Protecting Properties with Durable Security Fencing
- Written by Weekend Times
From residential homes to large commercial facilities, strong and reliable fencing provides peace of mind by keeping intruders out and safeguarding what matters most. Among the many options available, security fencing stands out as one of the most effective solutions. Built for strength, durability, and deterrence, it ensures that properties remain safe without compromising functionality or design.
What Is Security Fencing
Security fencing refers to fencing solutions specifically designed to protect properties from unauthorised access and potential threats. Unlike decorative or simple boundary fences, security fences prioritise strength and functionality. They are often constructed from durable materials such as steel, aluminium, or reinforced mesh. Many designs incorporate additional features such as barbed wire, spikes, or electric deterrents for higher-risk properties.
Why Security Fencing Is Important
Whether for homes, businesses, schools, or industrial facilities, security fencing provides the first line of defence against trespassing and theft. It acts as a physical barrier and a psychological deterrent, discouraging unauthorised individuals from attempting to gain access. In commercial and industrial environments, fencing is also essential for compliance with safety standards and insurance requirements. For homeowners, it provides reassurance that families and possessions are well protected.
Security Fencing for Residential Properties
Many homeowners in urban and suburban areas choose security fencing to enhance safety without compromising on appearance. Modern designs combine strong materials with sleek finishes, offering a balance between protection and style. High fences with lockable gates provide additional privacy, keeping both unwanted visitors and prying eyes away. Security fencing is especially valuable for homes with children or pets, as it ensures safe play areas within the property.
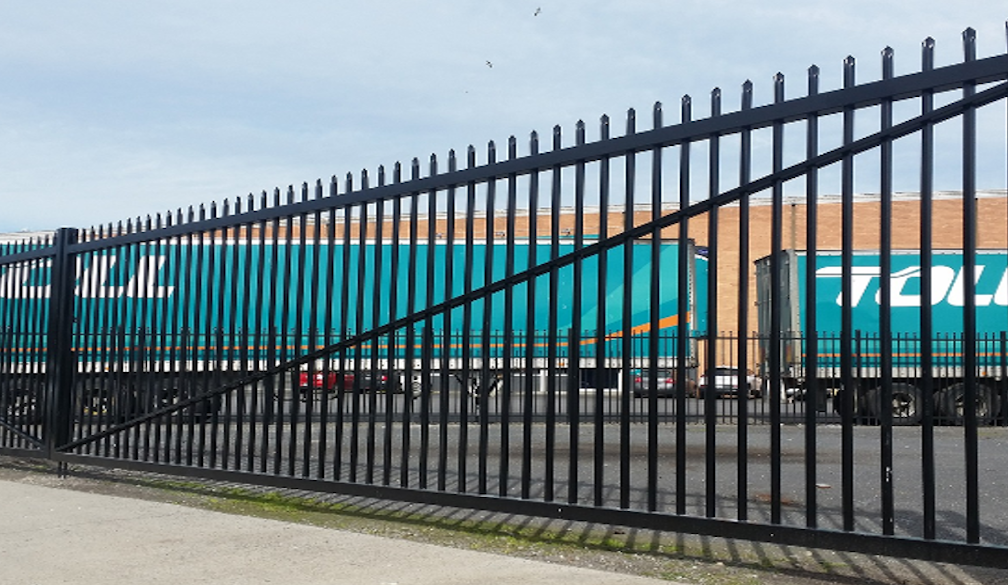
Commercial and Industrial Applications
For businesses, warehouses, and industrial facilities, security fencing is a necessity rather than a luxury. These properties often store valuable equipment, machinery, or inventory, making them prime targets for theft. Security fencing creates a robust perimeter, often paired with access control gates, CCTV cameras, and lighting for maximum protection. In high-security environments such as government buildings or utilities, advanced fencing systems are designed to resist climbing, cutting, and forced entry.
Materials Used in Security Fencing
The strength of security fencing lies in the materials used. Steel and aluminium are popular choices due to their durability and resistance to damage. Chain link and mesh fences reinforced with coatings provide flexibility and strength while being cost-effective. For high-risk areas, fencing can be fitted with razor wire, barbed wire, or electrified components. Homeowners often opt for powder-coated finishes that enhance durability while blending with architectural styles.
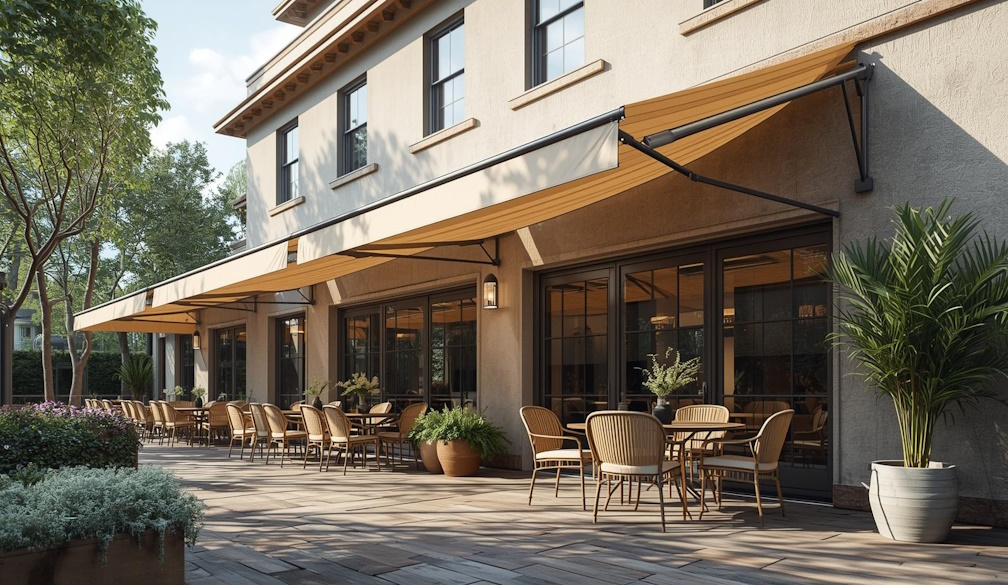
Design Options and Aesthetic Appeal
While functionality is the primary goal, modern security fencing does not have to sacrifice appearance. Many manufacturers offer designs that are strong yet visually appealing, allowing fences to blend seamlessly with the property’s style. Vertical bar fences, for example, are both secure and elegant, making them suitable for schools, offices, and homes. Customisable colours and finishes also give property owners greater flexibility in choosing fencing that enhances curb appeal while maintaining safety.
Compliance with Local Regulations
Installing security fencing often requires compliance with local council regulations. For example, certain heights or materials may be restricted in residential areas. Professional fencing contractors ensure that installations meet legal requirements while still providing maximum protection. For pool fencing and other specific applications, compliance is essential to meet safety standards and avoid penalties.
Maintenance and Longevity
Durability is a key advantage of security fencing. With proper installation and quality materials, these fences can withstand harsh weather conditions and years of use. Powder-coated finishes and rust-resistant metals extend longevity, while minimal maintenance ensures convenience for property owners. Regular inspections and minor repairs help keep fencing in top condition, ensuring long-term security.
Cost Versus Value
While security fencing may cost more upfront than standard fencing, its long-term value outweighs the investment. It protects against costly theft, vandalism, and liability issues, ultimately saving property owners money. For businesses, secure premises also mean greater customer trust and compliance with insurance policies. For homeowners, the added protection increases peace of mind and property value.
Conclusion: Peace of Mind Through Security Fencing
In today’s world, protecting property boundaries is essential for safety, privacy, and peace of mind. Security fencing provides a durable, effective, and often stylish solution for homes, businesses, and industrial facilities. With a range of materials, designs, and features to choose from, property owners can find fencing that meets both functional needs and aesthetic preferences. By investing in professional installation and high-quality products, security fencing becomes a reliable safeguard that delivers long-term value and confidence.