

The official figures say wages aren't growing — here's why they're wrong
- Written by: Peter Martin, Visiting Fellow, Crawford School of Public Policy, Australian National University
Have you heard about the latest wage figures? I hope not. They’re meaningless.
What the widely quoted measure of average weekly earnings[1] purports to show is that wages grew a mere 0.1% over the year to May. It’s not true. It’s not what happened. For most of us, wages grew by much more.
That’s not to say wage growth has been high — the best estimate is that private sector wages have climbed 1.9% over the past year and public sector wages a record low 1.3% — but both are still well above nothing, and generally well above our near-record low rates of consumer price inflation.
A check-in with reality would tell you that mid last year the Fair Work Commission lifted award wages 1.75%[2]. Mid this year it lifted them 2.5%[3].
So how could it be that the official figures, published by a trusted organisation, the Australian Bureau of Statistics, show average earnings static, climbing just 0.1%?
The first thing to say is that the bureau is probably embarrassed by the figures.
They are “not designed to produce movement in earnings data” it says on its website, before acknowledging that’s exactly what they are used for[4].
‘Not designed’ to measure wage growth
Australia’s pensions are adjusted twice a year in accordance with a formula that includes average weekly earnings.
The figure is built into private contracts and contracts for student loans and child support. If it wasn’t published, a lot of contracts wouldn’t work.
To create it, the bureau surveys about 5,130 employers every six months, asks what they are paying their workers, and uses the answers to calculate an average female wage, an average male wage, an average part-time wage, an average full-time wage, and a lot of other averages besides.
The ‘average wage’ isn’t typical
One problem is that averages are not representative. The survey suggests the average full-time wage is A$90,330[5], whereas in reality six in ten earn less.
The mid-way (median) full-time worker earns $10,000 less[6]. The average is boosted by a few enormously high earners and can’t be taken seriously.
An entirely separate problem arises when you try to use averages to calculate growth. The average is only an average of what’s averaged, and that can change.
When low-wage workers lose jobs…
Here’s an example. What would happen if a recession caused everyone working only four hours per week to lose two hours? It would push their earnings down and push down average weekly earnings, which would be about right.
But what if each of those people lost a further two hours, taking their hours down to zero. Their low hours would no longer be included in the total to be averaged, and (without them in it) average earnings would climb.
…the average wage goes up
That’s what happened a bit over a year ago. The bureau says COVID restrictions “led to a large decrease in the number of jobs, people employed and hours worked, with lower-paid jobs and industries particularly impacted, including jobs in accommodation and food services, arts and recreation services”.
 Unemployed catering workers pushed the average wage up.
PK Studio/Shutterstock
Unemployed catering workers pushed the average wage up.
PK Studio/Shutterstock
The loss of those lower-paid and low hours jobs in catering, the arts and other industries “had the effect of increasing the value of average weekly earnings”.
Layoffs pushed the average wage up.
Fortunately, the bureau says by November many of the low-wage workers laid off got some hours back, depressing growth in the average wage (but not growth in any actual wages) resulting in recorded growth of just 0.1% in the year to May.
Many have probably since lost hours with this year’s renewed lockdowns, pushing average wages (but not actual wages) higher again.
It’s enough to make you think the legislation and contracts should switch from a measure that’s close to worthless to one that actually measures wage growth.
The bureau offers such a measure. It’s called the wage price index[7], and the bureau has been trying to encourage people to switch to it since 1998.
Read more: Other Australians don't earn what you think. $59,538, is typical[8]
It is also built around a survey of employers, but rather than asking how much they pay each worker, it asks how much they pay for each job title and classification. The bureau calculates growth by comparing like with like, regardless of how many people were employed in each classification at the time.
Wage Price Index
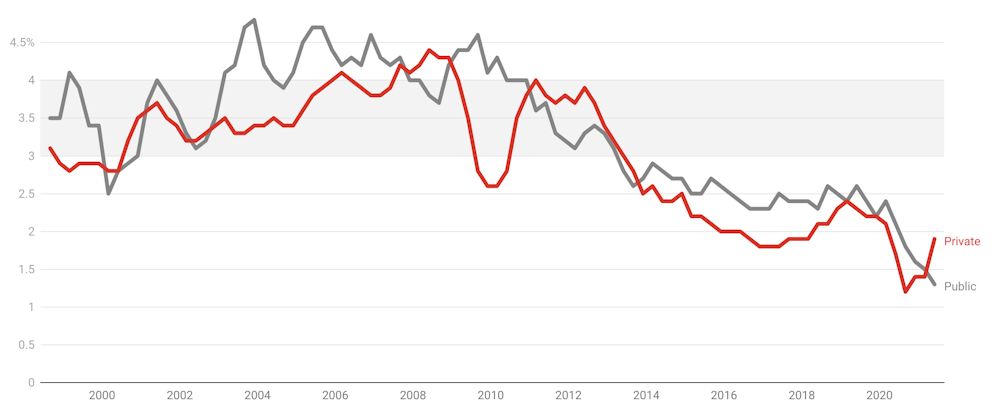 Annual growth in total hourly rates of pay excluding bonuses, public sector and private sector.
ABS[9]
Annual growth in total hourly rates of pay excluding bonuses, public sector and private sector.
ABS[9]
The results are believable: private sector like-for-like wages climbed 1.9% over the past year, and public sector wages 1.3%.
But even they are not right when it comes to the wage growth of individuals.
Individuals get promoted, and (much less often) demoted. They change jobs, usually for better ones.
People aren’t positions
So if you were trying to use the recent like-for-like wage growth of around 2% per year as a guide to what will happen to your own wage (in order, for instance, to work out whether you could afford a mortgage) you would probably guess too low.
It’s why many Australians — those who’ve got not only regular pay rises but also promotions — wonder what the fuss about low wage growth is about.
Read more: Top economists say cutting immigration is no way to boost wages[10]
A good measure of the actual wage growth of Australians doesn’t yet exist, although it might soon. The bureau is working on tracking individuals through the use of payroll data reported to the tax office.
In the meantime the (HILDA[11]) Household, Income and Labour Dynamics in Australia survey that tracks 17,000 Australians over time finds that the actual wage growth of full-time workers is indeed higher than the like-for-like figure suggests (which might help explain soaring home prices) although it too is weakening.
Part time workers don’t seem to get the same benefit.
As Mark Wooden[12], director of the HILDA survey puts it, “Australians in full-time work are doing pretty well – provided they remain in employment”.
References
- ^ average weekly earnings (www.abs.gov.au)
- ^ 1.75% (www.fairwork.gov.au)
- ^ 2.5% (www.fairwork.gov.au)
- ^ exactly what they are used for (www.abs.gov.au)
- ^ A$90,330 (www.abs.gov.au)
- ^ $10,000 less (www.abs.gov.au)
- ^ wage price index (www.abs.gov.au)
- ^ Other Australians don't earn what you think. $59,538, is typical (theconversation.com)
- ^ ABS (www.abs.gov.au)
- ^ Top economists say cutting immigration is no way to boost wages (theconversation.com)
- ^ HILDA (melbourneinstitute.unimelb.edu.au)
- ^ Mark Wooden (pursuit.unimelb.edu.au)
Authors: Peter Martin, Visiting Fellow, Crawford School of Public Policy, Australian National University